

Monthly Multiplier: EIG's May Highlights

One Big Thing
While overall national jobs numbers continue to inch upward, more granular data at the state and sectoral levels reveal a startling trend across the country: healthcare jobs in many states are booming, but most other sectors are stagnant.
“And no state appears as reliant on the healthcare and social assistance sector to support its labor market,” write EIG senior fellow Kenan Fikri and research associate Thomas Cronin, “as the nation’s most populous and the world’s fourth largest economy: California.”
New research from Fikri and Cronin finds that since March 2022 California has increased employment in these fields by a massive 25.3 percent, but has seen negative private-sector jobs growth otherwise.
California stands out from the pack, but it is not the only state where healthcare is masking labor market weakness overall. Georgia, New York, Oregon, New Jersey, Maryland, and Colorado all have experienced healthcare job growth exceeding 17 percent while employment in all other sectors in these states has expanded by 3 percent or less.
Nationally, jobs in healthcare and social assistance increased by a strong 16.3 percent, compared to just 2.9 percent in the non-health segments of the economy.
Amplifying EIG’s publishing of this research at Agglomerations, the Wall Street Journal printed a story in its Thursday May 14 edition anchored by these stunning findings. “EIG analyzed a three-year span of the most recent Labor Department data to cover a mixed period for the labor market, which saw a dramatic cooling off after a postpandemic hiring boom,” Harriet Torry and Josh Ulick conveyed to Journal readers.
While healthcare and social assistance jobs are not a bad thing to add to a state’s employment mix, the wages associated with them tend to be lower than in fields in which these states have suffered losses. Moreover, California, Oregon, and other states may see the healthcare sector struggle going forward with the dissipation of federal Medicaid spending.
“If this federal support starts to dry up,” Fikri told the Journal, “we’re going to soon discover whether the healthcare boom has legs sufficient to stand independently.”
Policy
EIG submitted a comment letter arguing that the Department of Labor’s proposal to raise prevailing wages for H-1Bs and green card applicants is based on flawed premises. EIG found that the proposal fails to account for differences in worker education, experience, and qualifications when estimating prevailing wages. The letter also argued that the proposal would continue to advantage large outsourcing firms and fail to select for top talent. EIG urges the Department of Labor to adopt the alternative proposal, known as Experience Benchmarking, to correct these flaws. EIG also noted, however, that fixing flaws within the H-1B program is a suboptimal solution overall and recommends market-based immigration reforms, such as selecting H-1Bs with the highest salary offers.
EIG issued a statement in response to the House passage of the 21st Century ROAD to Housing Act. John Lettieri, President and CEO of the Economic Innovation Group. “America cannot lower housing costs without building substantially more homes of all types,” said John Lettieri, EIG President and CEO. “This legislation takes meaningful steps toward that goal, and Congress should move quickly to get it across the finish line.”
Research & Analysis
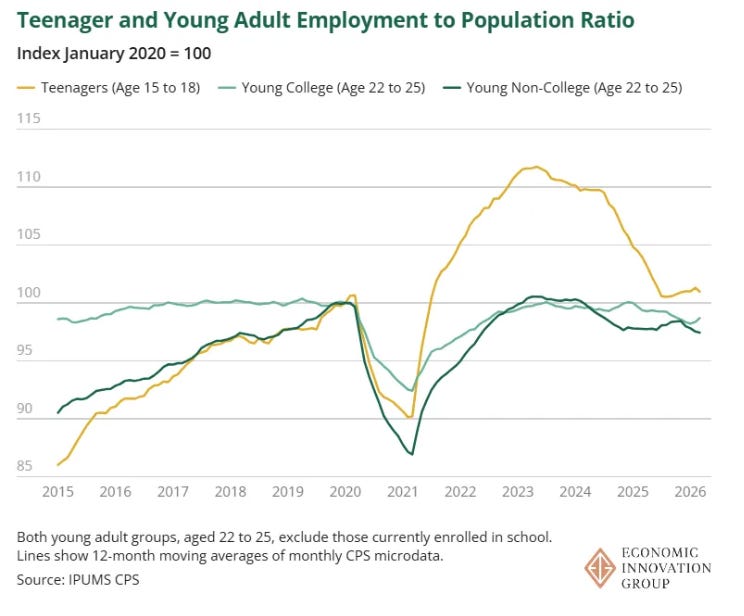
Smells like Teen Unemployment
The overall labor market appears reasonably healthy, but real weakness has seeped in and virtually all of it is concentrated in the young. Employment has fallen not just for recent college grads but also for noncollege young adults and for teenagers, making it unlikely that the cause of these problems is AI replacing worker tasks. Something else is going on. But what?
How Students and Recent Grads are Responding to AI
Sarah Eckhardt and Nathan Goldschlag find that undergraduates “are flocking towards the most-AI-exposed degrees, with enrollment in those degrees up 8 percent last year compared to 2017. This trend holds despite a notable decline in Computer Science degrees, one of the most-AI-exposed degrees, but whose decline is more than offset by increases in other exposed degrees like Engineering.” One reason why is that the jobs these students are likely to be offered still pay very high wages.
The Problem of Partial Noncompete Bans
Partial noncompete bans can be net positives if they are carefully written and apply to a wide swath of workers, but too often the exemptions — some of them quite absurd — lead to mass confusion, chicanery on the parts of employers, and unenforceability. The evidence is clear, write Thomas Cronin and Ben Glasner: “Banning noncompetes for certain job types or income levels helps curb some abuses, but it leaves intact many of the mechanisms by which noncompete agreements hurt most workers and stifle innovation and entrepreneurship. The best way to achieve a stronger, fairer, and more dynamic economy is for states to ban noncompetes entirely.”
Around the Horn
For the National Bureau of Economic Research, Nathan Goldschlag and coauthors have issued a working paper examining the relationship between patents and economic growth.
Kyla Scanlon compiles ways to respond to the rise of AI, including “Be AI native, not AI proof” citing the post on students and young graduates from Sarah Eckhardt and Nathan Goldschlag.
In City Journal, Jordan McGillis explains the fraught labor dynamics hindering autonomous trucking in California.
In National Review, McGillis argues against a federal subsidy for an Alaskan pipeline.
In The Dispatch, McGillis applies EIG’s Distressed Communities Index to family housing decisions.
And also in National Review, McGillis has published a longform reported essay on the U.S. Geological Survey’s Earth Mapping Resources Initiative.
In Newsweek, Billal Rahman quotes Sam Peak on increased scrutiny of the H-1B program.
In an essay for the Washington Post, the University of Notre Dame’s Alexander Kustov highlights EIG’s survey work showing public support for high-skill immigration.
Also in the Washington Post, reporters Shira Ovide and Rachel Lerman drew input from Nathan Goldschlag in their coverage of AI’s effects on the labor market.
Coverage of the Trump administration’s new retirement plan continues, with reporters citing Ben Glasner and Sarah Eckhardt’s pivotal research on the issue in USA Today and Forbes.
EIG Chart of the Month
Via Kenan Fikri’s post on the dominance of health care jobs in the California labor market:
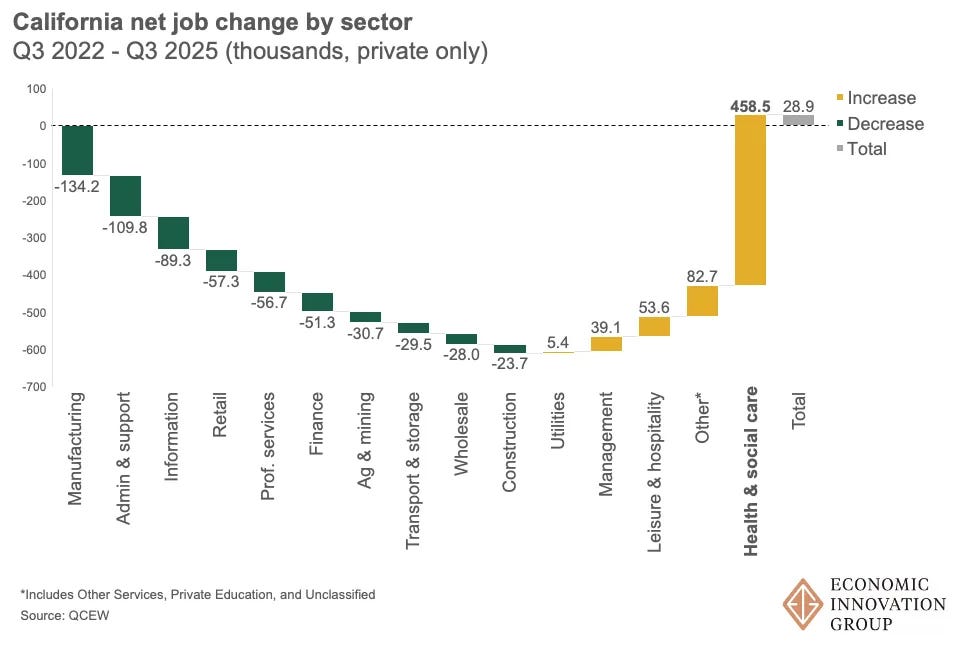
as usual plenty of good stuff to chew on. that chart is just weird though. If I cant understand it in about 3 seconds, I'm moving on. why doesnt it simply use a zero baseline? why is construction located at ~ -600k? what are you trying to tell me?