

Forget AI. The California job market is powered by healthcare
But is the trend benign or malignant?


Another monthly jobs report, another reminder that healthcare has been the driving force behind U.S. job growth in recent years. Given that healthcare is used by everyone, everywhere, we initially assumed that all those new healthcare jobs would be evenly distributed across the map, varying only by rates of population growth or shifting demographics.
Not so. Healthcare job growth varies dramatically by state, as does the extent to which healthcare contributes to total job growth. And no state appears as reliant on the healthcare and social assistance sector to support its labor market as the nation’s most populous and the world’s fourth largest economy: California.

Another take on a “health-full” labor market
The total number of jobs in the United States increased by 4.7 percent from March 2022 to March 2026, but the differences across sectors were massive.1 Jobs in healthcare and social assistance increased by a whopping 16.3 percent, compared to just 2.9 percent in the non-health segments of the economy.2 Artificial intelligence (AI) may dominate financial markets, but healthcare still reigns supreme in the labor market.
Scan the figures in the charts below, and it becomes apparent just how geographically disparate job growth has been over the past four years even in this quintessentially local sector.

California outpaces every other state with its 25.3 percent job growth in healthcare and social assistance from March 2022 to 2026 — and that growth wasn’t being powered by a quickly rising population. The number of California residents increased by less than 1 percent between 2022 and 2025.3
But what really distinguishes California is how it combines such massive growth in healthcare with such little growth in other parts of the economy.
California eked out total job growth of a mere 3.4 percent over the past four years, the bulk of which was racked up at the beginning of the period (see the top figure). Take out healthcare and social assistance, and employment across all other sectors in the state declined by 0.3 percent. Over the past four years, employment in the non-care portions of the economy shrunk in only three other states, led by DOGE-walloped DC.

The growth gap between the health and non-health parts of the economy (the length of the bars in the above graph) is greater in California than in any other state.
Healthcare now accounts for 17.4 percent of all jobs in California, up three percentage points in four years. That is twice the rate at which healthcare is expanding its dominance over the labor market nationwide.
All subsectors go
Growth was solid across all four main subsectors of the California care economy. Employment in hospitals increased 5.2 percent, in ambulatory medical care (think doctors’ and dentists’ offices) by 15.7 percent, in nursing home facilities by 17.2 percent, and in social assistance by 27.2 percent over the past three years.4
Even more granularly, 36 of the 39 narrow industries that make up the care sector added jobs over the most recent three-year window.5 In absolute terms, services for the elderly and disabled topped the list, adding a whopping 211,000 jobs (31.5 percent increase) and accounting for nearly half of all job growth in the state’s care sector.6 Mental health practitioners led the way in percentage terms, with the ranks of California therapists nearly doubling (92.7 percent growth, or 27,212 new jobs).7
These numbers are huge but not anomalous. Nearly every corner of the care economy is growing, and no single corner can explain the larger sector’s might.
Nevertheless, it is striking how exceptionally low-paid these new jobs in services for the elderly and disabled are, coming in at $487 a week on average (or just over $25,000 per year) in the state.8 This is the lowest paid sub-sector of the entire care economy and one of the lowest paid in the entire economy, too.

Stepping back, it is also notable just how starkly the robust growth across basically every corner of the care sector compares to weak growth across the rest of California’s economy.
Trading down?
Lay out all the pieces and it becomes clear that, as the California economy evolves, jobs in high-wage sectors are being replaced by jobs in low-wage sectors. Jobs are shifting from manufacturing, information (tech), and finance and professional services into much lower-paying care roles. States such as Idaho are adding jobs in both high- and low-wage sectors. California is undergoing a great labor market transformation towards lower-paid work.
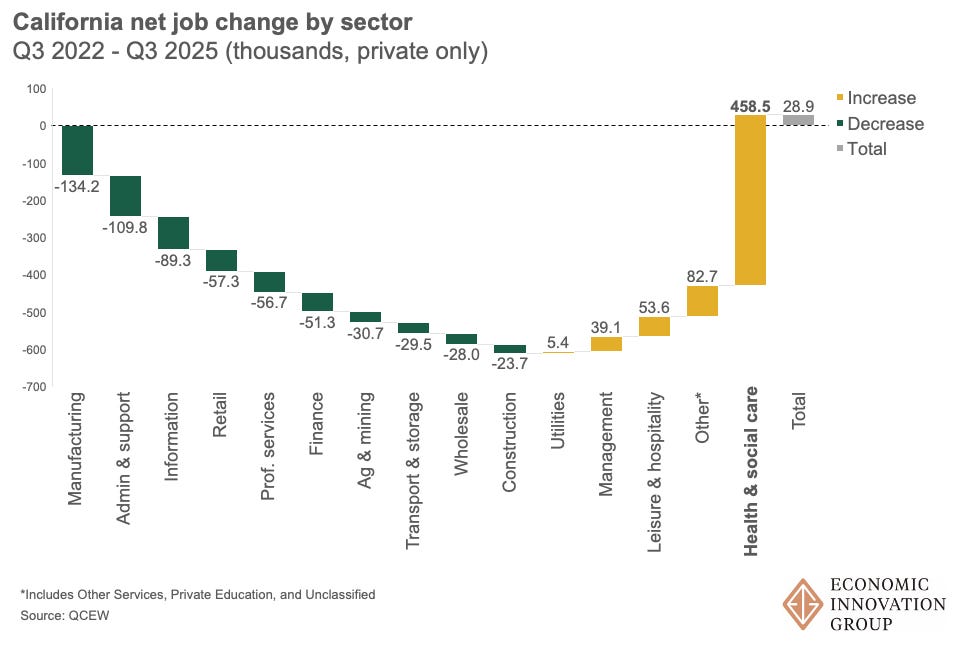
Consider this rough estimate: Multiply the average weekly wage in each sub-sector in Q3 2022 by the number of jobs gained or lost over the subsequent three years (essentially an expanded version of the above chart with the most granular subsectors available), and California workers shed around $1.26 billion in inflation-adjusted earnings a week through this sectoral trading down. That equates to $65.4 billion annually, and this amount is actually an understatement of the composition change’s effect because the total number of private sector jobs grew slightly (by 28,900, as shown in the rightmost column above) over this time period.
Diagnostic check
Could these findings be figments of the data — statistical or administrative blips that don’t reflect economic realities on the ground?
Our analysis was conducted using two Bureau of Labor Statistics’ (BLS) datasets, State and Area Employment, Hours, and Earnings (SAE); and QCEW. The latter, which is derived from state unemployment records, feeds into the former, which adds survey responses from BLS’s Current Employment Statistics series to offer even more timely estimates. QCEW is derived from high-quality administrative data and forms the benchmark for numerous other labor market series. California’s sheer size translates into high-quality data estimates across both sources.
Nor do there appear to be any California-specific biases in the largest subsectors driving the trends, such as Services for the Elderly and Persons with Disabilities (or NAICS 62412 in the classification system used by statistical agencies; see the footnotes). Concerns about how home health aides are scoped and categorized at the establishment level — is each home they work in considered an establishment, or only the main employer or agency home office? — do not apply to this exploration of jobs. What is more, any anomaly in one corner of the Health Care and Social Assistance sector (NAICS 62) is unlikely to explain weaknesses in other sectors. It’s highly unlikely that a care worker would be misclassified into manufacturing, retail, or tech, for example. Across the board, the state’s relative estimates appear in line with others; they simply add up to a story that is unique to the Golden State.
California has the highest foreign-born share of the population of any state. Perhaps the spike in care jobs somehow extends from President Trump’s immigration crackdown, as once-informal jobs are formalized or native-born workers begin to occupy the positions vacated by departing migrants?
Here too, the evidence doesn’t match up. The largest increase in care economy jobs appears in the first quarter of 2024, well before the election. The rate of increase in elderly services held steady around 3 percent per quarter from Q3 2024 through Q3 2025. And while it’s true that immigrants are overrepresented in the home health care industry (NAICS 621) and undocumented immigrants occupy a range of healthcare support roles, we would expect to find evidence to support the formalization hypothesis in construction and other industries, too, where the immigrant share of the workforce is even higher. The fact still stands that few sectors are expanding in the Golden State beyond healthcare.
Prognosis
What does the present composition of job growth mean for the future of the California economy? It’s hard to tell, but the rate at which the Golden State is shedding jobs in its highest-value sectors like tech and professional services while adding them in decidedly duller corners with more dismal wages is cause for concern. With a gubernatorial election this year, a billionaire tax possibly on the ballot, and soon-to-be-former Governor Newsom preparing for a potential presidential run, closer examination of the California model is also of national interest.
California’s population is not especially old or feeble. Only 16.5 percent of its population is 65 or older, making it the sixth-youngest state on this measure. Californians also report fewer chronic health conditions than almost anywhere else. So why is its healthcare sector so mighty?
One plausible partial explanation is that state policies are driving the outcome — in other words, that government subsidies are allowing more people to access more healthcare and social support, stoking demand.
And indeed, many of those new therapy jobs are probably supported by the state’s Children and Youth Behavioral Health Initiative, a $4.6 billion dollar program launched in 2021 to connect youth with mental health services. Enrollment in Medi-Cal, the state’s medicaid program, has increased significantly over the past decade as the state has continuously expanded coverage, including in recent years to undocumented populations. As a result, only 5.9 percent of Californians went without health insurance in 2024, a record low. The extensive margin (new enrollment) isn’t the only one at work; the intensive margin (use of healthcare services) is too. The state legislature has noted that Medi-Cal spending per enrollee is increasing even faster than the number of enrolled. Both greater utilization and greater coverage are driving demand and creating jobs in the process.
So how should we think about the care economy in the broader context of the California labor market? Is it an economic engine, a useful jobs sponge? Or does it represent an unhealthy dependence? Is the care economy picking up the slack left by weakness in other sectors or crowding out growth?
And given how intimately involved the public sector is in healthcare finance, we have to ask where the public support is coming from and what tradeoffs are involved with raising resources from one corner of the economy to spend them in another.
And then, finally, we have to ask how the political economy changes when healthcare spending effectively becomes a jobs program.
We might start to get some answers to these questions over the coming months, as the Medicaid- and healthcare-related portions of the One Big Beautiful Bill Act work their way through state coffers. Medi-Cal’s expansion was not only fueled by the state’s swelling tax receipts after the pandemic. It was also made possible by federal largesse and a tax on private plans that will be subject to heightened federal scrutiny going forward.
States that expanded Medicaid under the Affordable Care Act now have a nearly 3 percentage point greater share of their workforce in healthcare jobs than those that didn’t on average. A dozen expansion states have triggers that could discontinue or dial back their support if federal funding dries up — which it is poised to do. We may soon get a better sense of the extent to which the healthcare jobs juggernaut has been fueled by Washington, and whether it has legs strong enough to stand independently.
Where does that leave us? Healthcare has driven the plot in the national jobs story for several years running. The subplot of weak growth in other good jobs sectors may carry the narrative from here.
They say the future happens first in California. What we don’t know is how healthy it will look.
We use the Bureau of Labor Statistics’ State and Metro Area Employment, Hours, and Earnings (SAE) data series for this section. March 2026 is the latest available data, and the four year retrospective provides a clean post-pandemic analysis window.
“Health Care and Social Assistance” refers to the BLS-defined industry code NAICS 62, which is intended to broadly capture the healthcare job market. Note that this sector encompasses the delivery of medical and social care, but not the manufacture of pharmaceuticals or health care devices, or bio-tech activities generally. Delivery should basically scale with the size of the population being served, subject to state policies, while higher-value added and more traded production and innovation activities tend to cluster more geographically.
Source: U.S. Census Bureau Population Estimates
Because the SAE only covers a small fraction of detailed industries, we use the BLS Quarterly Census of Employment and Wages (QCEW) dataset for this section. The latest available release of QCEW data is for Q3 2025, so we shift the timeline of our analysis accordingly. In order, these labels refer to NAICS 621, NAICS 622, NAICS 623, and NAICS 624.
The three detailed industries that did not grow were kidney dialysis centers (NAICS 621492), medical laboratories (NAICS 621511), and urgent care clinics (NAICS 621493).
NAICS 62412.
NAICS 62133.
QCEW provides our average weekly wage data, too.
I'd love to see a similar analysis for New York, given the dominance of "eds and meds" in the upstate NY economy. Colleges and universities are hitting the demographic cliff and/or losing federal research dollars. And what's going to happen to healthcare as more people lose access to insurance?
Great work, thanks.