
One Big Thing
Back in 2015, when we at EIG published the original paper on Opportunity Zones, we knew that OZs had unique potential to boost economic growth in distressed parts of the country. OZs became law in 2017, catalyzing a wave of investment in communities all across America.
Newly-released data from the Treasury Department on the success of OZs proves just how valuable the policy’s incentives have been.
Here’s what we now know:
The average state benefited from more than $2 billion in OZ investment through the end of 2024.
There are more than 12,000 active OZ funds operating nationwide. These funds aggregate qualifying investment capital from 41,000 different taxpayers, 35,000 of which are individuals and 6,000 of which are corporations.
In total, the funds hold $116 billion in total assets and $112 billion in tangible assets at work on the ground.
The OZ tract designations we helped governors with in 2017 and 2018 translated into investment for 77 percent of all OZ census tracts across the 50 states and the District of Columbia.
Rural tracts were no less likely to receive investment — a proportional 77 percent of rural tracts registered OZ investment.
With OZs having been made a permanent feature of the tax code last summer, Congress has now called for a new round of OZ census tracts to be designated.
Here is what we recommend to governors going forward:
Get moving now. While some states have actively communicated the latent value of OZs to potential investors, others need to get in gear as the 90-day designation window has now opened.
Set a statewide economic vision. OZs should be an integrated part of a growth strategy, not an afterthought.
Designate a lead coordinating entity within state government and hold it accountable.
Engage local partners strategically. State strategy only works when it’s tied to local needs and opportunities.
Balance economic need and investment potential. The most distressed areas may not necessarily reflect the best mix of characteristics to maximize outcomes.
Combine both quantitative and qualitative insights. There’s an art to OZ designation that goes along with the science.
Embrace purposeful transparency.
Align OZ nominations with supportive policy tools
OZ designation is one of the most powerful economic development tools at a governor’s disposal and the ball is now in governors’ courts to bring the immense benefits of targeted investment to the corners of their states that need it.
For EIG’s full analysis of the new Treasury Department OZ success report, click here.
And for EIG’s full OZ designation breakdown guidance, click here.
Policy
Treasury's data update wasn't the only big OZ news this month. EIG's Opportunity Zones Coalition submitted its priorities to Treasury for the successful implementation of OZ 2.0. The Coalition also submitted a letter responding to Treasury's recently published transitional guidance for Opportunity Zones. In it, the coalition thanks the agency for providing helpful clarification on several matters, and raises concerns related to Treasury’s assertion that property acquired in zones set to expire in 2028 cannot qualify as Qualified Opportunity Zone Business Property after December 31, 2026, except under limited circumstances. The letter recommends that Treasury push the effective date for the requirements to the end of 2028 to allow existing OZs to use their full designation, among other recommendations.
Research & Analysis
Measuring the Economic Effects of AI
“How many firms are using Artificial Intelligence?,” writes Nathan Goldschlag. “What are they using it for? How many workers are using AI, and how are they using it? To track and understand the effects of AI on the economy, researchers will need accurate, detailed, comprehensive answers to these fundamental questions.” In a comprehensive new report, Nathan details what policymakers and the nation’s stats agencies should do to better answer those questions.
The Last Ten Per Cent
Estimating the exposure of a given task to being automated by Artificial Intelligence is the only the first step to understanding AI’s potential effects on the labor market. Josh Gans, an economics professor at the Rotman School of Management at the University of Toronto and chief economist of the Creative Destruction Lab, explains the remaining nuances in a new guest essay for The American Worker Project.
America’s most prosperous neighborhoods are barely 25
“Here’s a striking observation as the nation celebrates its 250th birthday: its most prosperous neighborhoods are barely 25 years old,” writes Kenan Fikri in a provocative new study. “While America’s well-off places come in many forms and have many birthdates, when a neighborhood was built turns out to be a pretty good predictor of the level of economic well-being enjoyed by its residents. Generally speaking, our best-off neighborhoods are those with the shortest histories.”

Exceptions to the American manufacturing jobs decline
In response to a reader’s request, Jiaxin He scrutinizes the data on manufacturing employment to find the subsectors that have been most resilient: electrical components (AI) and transportation equipment (aerospace). Both sectors have not only grown since the post-COVID peak but also have continued their growth into 2026.
Around the Horn
In a Senate hearing on Capitol Hill, Mercatus Center fellow Liya Palagashvili invokes both an Agglomerations essay by Adam Ozimek and an EIG guest essay by Google economists Zanna Iscenko and Fabien Curto Millet on AI and employment.
In a paper from Stanford’s Institute for Economic and Policy Research, former head of the Bureau of Labor Statistics Erika McEntarfer and co-authors apply work from Nathan Goldschlag and Sarah Eckhardt on separating AI hype from real productivity improvements.
In the New York Times, Ben Casselman quotes Nathan on how to measure AI’s economic impacts.
In City Journal, Sam Peak and Jiaxin He argue for tailored changes to the H-1B program to improve high-skill immigration outcomes.
Also in City Journal, Jordan McGillis discusses Alaska’s frontier resource economy.
In the Wall Street Journal, Anne Tergesen and Veronica Dagher cite research from Kenan Fikri on retirees starting businesses.
And in Inc., Georgia Fearn quotes Kenan on the importance of contextualizing healthcare job growth across the country.
In Newsweek, Giulia Carbonaro draws upon EIG data in a piece on the Trump administration’s new retirement plan.
For Kiplinger, Daniel Goodwin promotes EIG’s Opportunity Zones Activity Map.
In Forbes, Damini Sood cites EIG research on rural economic growth.
In Canada’s Globe and Mail, Mike Moffat cites EIG work on the departure of middle-class taxpayers from big cities.
And in the American Spectator, Jordan explains how the Declaration of Independence sparked 250 years of economic dynamism.
The New Bazaar
Economist Alvin Roth, winner of the economics Nobel in 2012 for his work on market design, joins host Cardiff Garcia to discuss his new book, Moral Economics: From Prostitution to Organ Sales: What Controversial Transactions Reveal About How Markets Work.
The book is about morally contested markets: transactions that participants would like to engage in but that others think they shouldn’t be allowed to, even when it’s hard to identify measurable harms to those objectors. It’s also a great way to understand how markets interact with the law, politics, social norms, income inequality, human psychology, and so much more than just monetary exchange.
In this chat, Alvin and Cardiff discuss:
Medical aid in dying and the economics of “repugnant” markets
Sex work, trafficking, and the unintended consequences of criminalization
Plural marriage and the challenge of designing new legal protections
Sports gambling and the rise of prediction markets
Kidney exchanges, the transplantation shortage, and the opposition to cross-border exchanges.
Throughout the conversation, they confront the trade-offs involved in both allowing controversial markets and trying to ban them.
EIG Chart of the Month
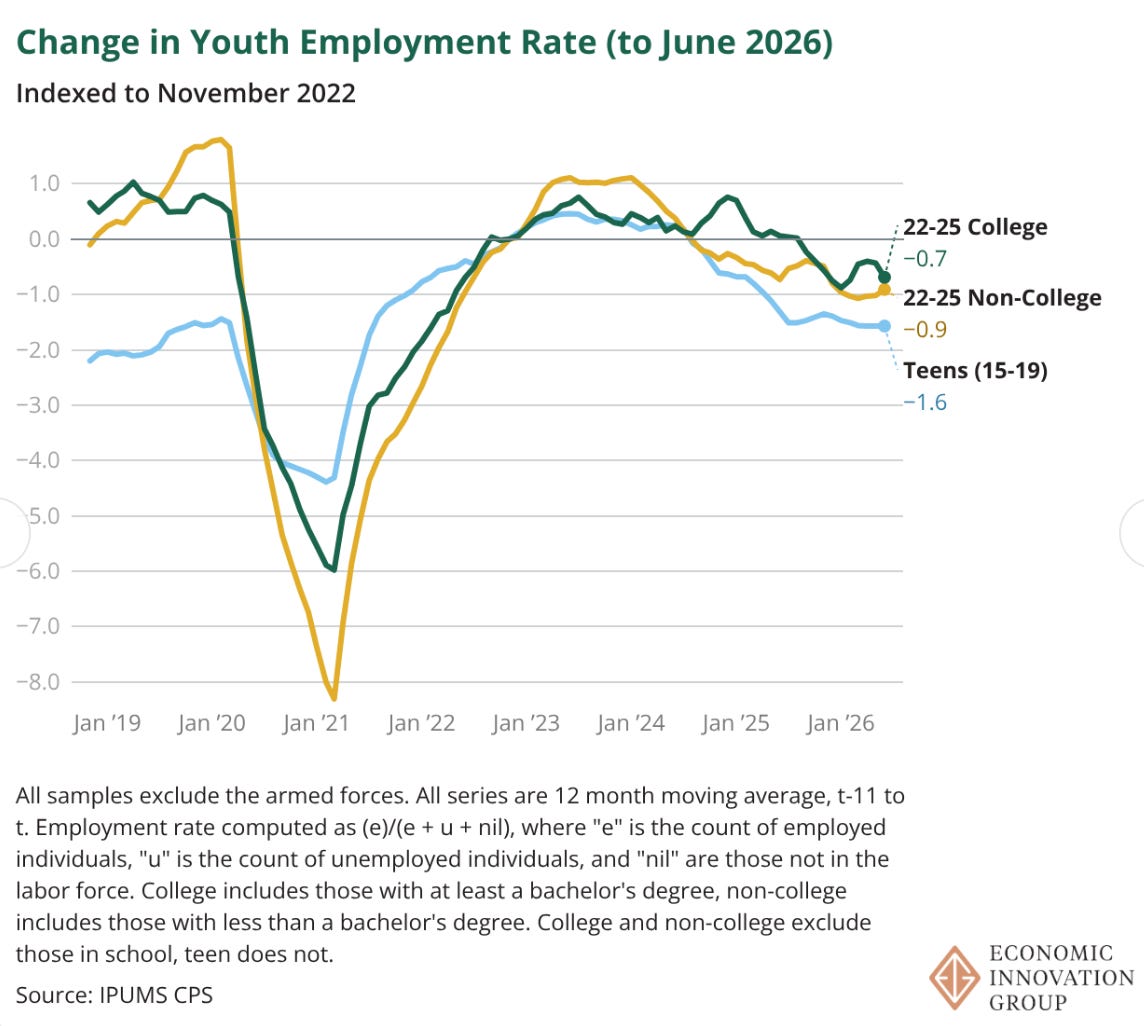
EIG research director Nathan Goldschlag oversees a number of frequently updated dashboards on his personal site, including one that features this chart showing that young adults, both college and non-college, are struggling: