


Every three years, the Federal Reserve releases the Survey of Consumer Finances (SCF), an event that econ nerds anticipate as if it were opening night for The Odyssey, the Traylor wedding, a new George RR Martin installment, or literally any news at all about Star Wars.
The Fed published the most recent iteration of the survey, with data updated through the end of 2025, just a few weeks ago. In its analysis of the results, the Wall Street Journal dropped an eye-popping chart:
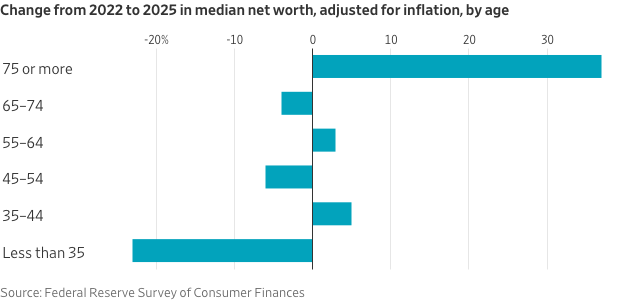
The SCF shows a 23 percent decline in median net worth, or roughly a $10,000 drop, among those households that are headed by someone less than 35 years old. (All of the values in this analysis are presented in 2025 inflation-adjusted dollars using the PCE price index.)
The 75+ crowd, meanwhile, registered a 38 percent increase, or a staggering gain of $139,000.
Begun, the generational wars have…
Or have they? It’s important to understand the context behind the numbers, especially given that the comparison year of 2022, the starting point for the gains and losses, was close enough to the COVID aftermath that the numbers might include some idiosyncratic distortions. Below I discuss a few other caveats to consider as well.
Historical Context: Big Up, Tad Down
For about three decades, the typical young household had between about $13,000 and $23,000 in net worth. Then, in 2022, that figure more than doubled from its 2019 value, climbing to about $43,000, a record high.
The results in 2025 point to young-adult households losing some of the gains from that peak number three years earlier, but it is still the second-highest year on record, as is clear in this chart:

How Many People Are We Talking About?
The SCF is a series of household interviews that asks detailed questions about what these households own and owe. In 2025, about 4,400 households were surveyed, and roughly 630 of those were headed by someone under 35 years old.1 Each of those 630 households is therefore a stand-in for about 42,000 young households across the country.
The SCF is a great data source, but with only about 630 young households, it is worth considering whether the drop in net worth is actually bigger than the statistical noise from the sample.
The range of plausible values for the under-35 population runs from about a 45 percent drop to an 8 percent gain. It crosses zero, which means we cannot say (within the 95 percent confidence range) that even an outright drop is statistically significant.

Did median wealth for the under-35s probably fall? Yes, it probably did. But 23 percent is a best guess and has a huge confidence band around it, somewhere inside of which is the “true” value.
The reason I feel confident in writing that it probably fell even though a change of zero and even positive growth sit within the confidence interval is that the average net worth for the under-35s fell by 32 percent, and the decline in this case was statistically significant.
As for what explains the drop, the Fed itself links it to the fact that business wealth surged between 2019 and 2022 before it then receded by 2025.2 But only about 10 percent of under-35 households actually own a business,3 which means that the cause of the measured decline in average wealth is attributable to a small slice of an already small sample, an unweighted sample size of just 72 households in 2022 and 67 households in 2025.
Smaller Slice, Biggest Blame
Finally, for any time series with age cutoffs, there will be different slices of cohorts who age out and up the age ladder. Narrowing the view, median net worth for households headed by a person born from 1995–99 climbed from about $23,000 in net worth in 2022 to about $38,000 in 2025. So this particular slice of the under-35 category did much better than the overall under-35 cohort.
In general, younger age cohorts have enjoyed significant gains relative to the previous generations and older cohorts, which is clear in this chart, also derived from the SCF:

But it can be said with a lot of confidence that the drop in under-35 mean net worth did happen, and that the point estimate for under-35 median net worth fell. Which age band is most responsible for the decline?
Specifically, it was the 30- to 34-year-old bracket, whose median net worth fell from about $98,000 in 2022 to about $64,000 in 2025. Net worth for other young households, those with heads under 30-years-old, only slightly fell, from $20,200 to $19,500.4
So if anyone wants to build a narrative out of the findings about under-35s, it should be about what happened to that age band in particular — and not, to give just one example, a story about young college grads being displaced by AI.
The caveats raised in this analysis should obviously not be taken as a dismissal of the SCF or the reporting that follows its release. The SCF is an extremely valuable source of data. But the discovery of trends that appear surprising should not simply be reported; they should also be accompanied by detailed context and used as a catalyst to further scrutiny into what is driving them.
See our GitHub with replication code here.
If a young adult lives with their parents, they would not be counted as the head of their own household and would then not be part of the population we are talking about here, which are households headed by young adults. That being said, their net worth would contribute to the household head they are living with if they share finances with them.
The Fed’s report stated: “These declines in net worth among young families are primarily driven by the unwinding of business equity gains between 2019 and 2022.”
User analysis of the SCF 2022 and 2025.
This decline is a drop in the point estimate of 3.6 percent, but a 95% interval around the estimate ranges from −35 percent to +44 percent.
Would be interested if there’s a composition change helping drive the wealth effect. Has the proportion of under 35s heading a household declined meaningfully over the observed period?