

Charts of the Year
The 10 best visuals we produced in 2025

“Mankind invented a system to cope with the fact that we are so intrinsically lousy at manipulating numbers. It’s called the graph.”
— Charlie Munger, Talk 3 of Poor Charlie’s Almanack
When done right, a good chart is dense with information but still easy for the reader to mentally process, making its insights fun to absorb and to share.
At EIG we find that charts are especially valuable for communicating unexpected findings that seem counterintuitive — discoveries that alter how readers understand the world and thus are likely to stick in their minds.
We looked back through our publications this year and we’ve plucked out the charts we made that best satisfy this criteria. Here they are, in no particular order, each with notes or direct quotes from the original article in which they appeared.
1. On the AI Vibes Gap: “Workers who don’t use Artificial Intelligence are 31 percentage points more likely to say that AI is a threat to jobs than workers who do use it. One plausible reason why the gap is so large is that using AI makes its (current) limitations more salient — functioning as a kind of exposure therapy that inoculates workers against fears about its impact. Or maybe using AI highlights the ways that it can complement their work.”

From: Peeling the AI Anxiety Onion, by Nathan Goldschlag
2. How long you live is correlated with where you live: “Residents of the average prosperous county live over five years longer than those in the average distressed one, widening to 8 years in the top and bottom percentiles.”

From: The geography of American exceptionalism, by Kenan Fikri and Sarah Eckhardt
3a. Young families are no longer leaving cities. In 2024, the population of children under 5 years old stopped falling in the largest urban counties for the first time since the pandemic — though it hadn’t started reversing its earlier declines either.

3b. “Among 83 large urban counties, Manhattan (New York County) had the steepest decline in young kids since April 2020, 18.9 percent. Brooklyn is right behind, with a 17.8 percent decline.”

From: Young families have stopped leaving big cities, for now, by Connor O’Brien
4. Is employment in the auto sector in secular decline, or is it near its all-time highs? It depends on how you measure it, and specifically if you’re relying on surveys of workers or surveys of businesses. Beware of simple narratives, especially in manufacturing industries.

From: How many manufacturing workers are there?, by Adam Ozimek, Ben Glasner, and Jason He
5. What should elected officials be focused on? In our nationwide survey, workers responded that lowering costs of essential items (food, clothes, gas) and making housing more affordable should be the top priorities. Even more striking is the item that finished dead last: raising tariffs.
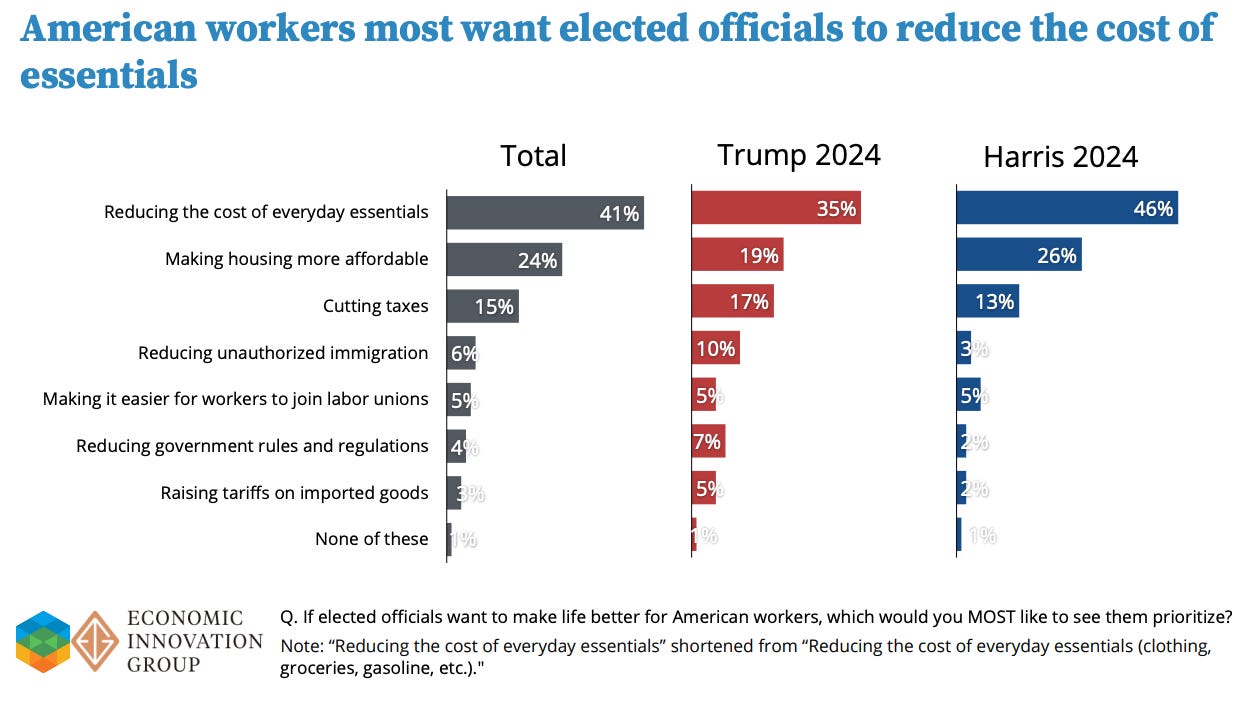
From: The 2025 American Worker Survey
6a. “New housing construction within the densest counties has been concentrated in some of the least dense neighborhoods — in most cases, the outer-ring suburbs,” while the “densest 10 percent of tracts — the downtowns and urban cores — are building more housing relative to their populations than the next 20 percent — the inner-ring suburbs surrounding downtown neighborhoods.”

6b. Success stories: “Over the past decade, the downtowns of Seattle and Atlanta have built new homes at a similar rate as the suburbs of Arizona and Texas — around 200 homes for every thousand residents… Consequently, Seattle and Atlanta are also among the more affordable large cities for residents when compared to the area’s wages.”

From: Not Just Suburban Sprawl — Dense Places Can Still Build, by Jess Remington
7. “As of 2023, only 37 percent of international graduates earning a bachelor’s, master’s, or doctoral degree between 2012 and 2021 remained in the United States. That includes fewer than 1 out of every 5 bachelor’s degree recipients.”

From: The U.S. loses most international graduates it trains. That problem is about to get worse., by Connor O’Brien.
8. “All domestic manufacturers buy at least some of the intermediate inputs and capital equipment they need to make their products, but high-tech manufacturers source a higher share of those inputs and equipment from abroad.”

From: Blunt tariffs undermine efforts to reshore high-tech manufacturing, by Jason He and Connor O’Brien
9. The high-skilled immigration needs to be overhauled and expanded, because the existing system is truly an outrage:
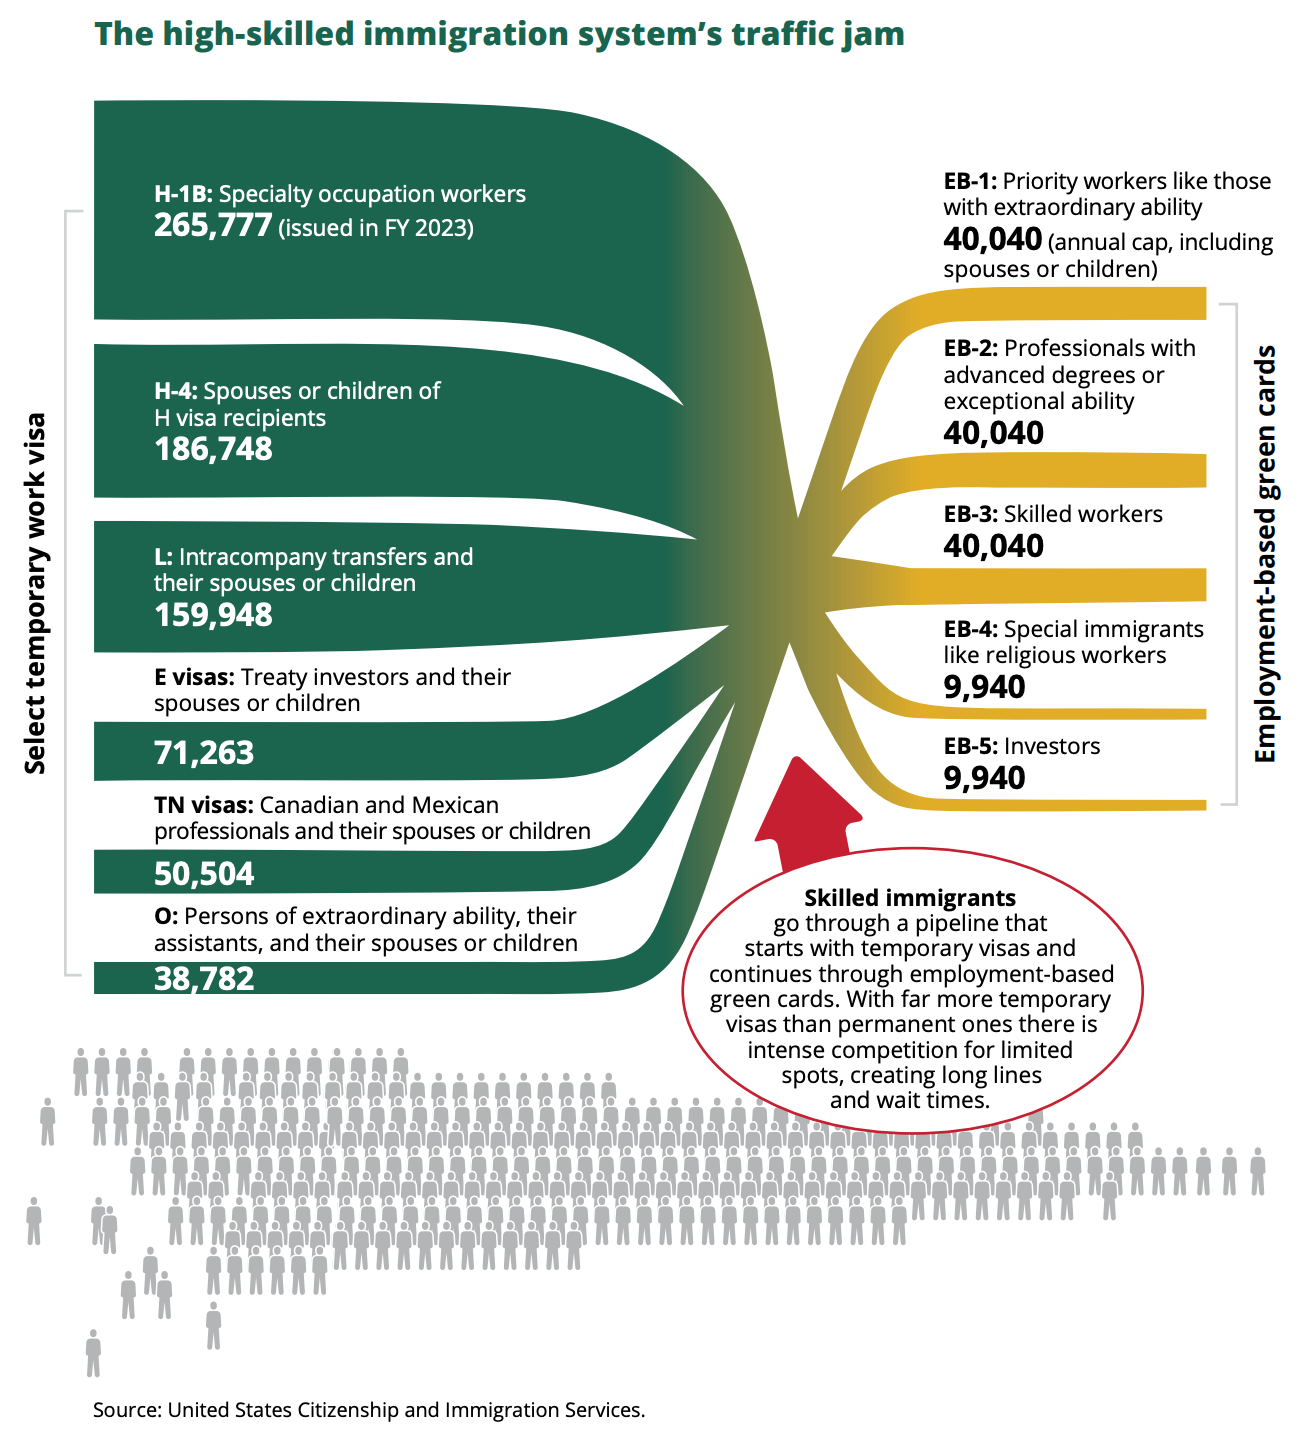
From: Exceptional by Design, by Adam Ozimek, Connor O’Brien, and John Lettieri
10. “Both before the pandemic and after, manufacturing job growth in right-to-work states has outpaced that in states without right-to-work laws. Nationwide, unionized manufacturing jobs are down more than 15 percent since 2010, while non-union roles are up more than 10 percent.”

From: Silicon Heartland: The Evolution of Ohio’s High-Tech Workforce, by Connor O’Brien